datagov-mcp

MCP.Pizza Chef: aviveldan

Thirteen tools sit on top of the Israeli government's open data portal: ten for finding datasets, reading what is in them and pulling out rows, plus three that draw an interactive summary table, a chart or a map. No key or account is needed, because the portal is public. Two things to expect. Dataset names and column headings are largely in Hebrew, and charts are built from the first hundred rows only, so a picture of a large dataset is a sample rather than the full story.

Data
Web/Research

Use This MCP server To

Search Israeli government data for a topic I care about See what columns and value ranges a dataset holds Chart which cities have the most housing lottery entrants Plot public transport stops on a map Pull the actual rows out of a public dataset Compare two datasets before deciding which to use

README

DataGov Israel MCP Server

An MCP server for exploring Israeli government open data (data.gov.il) β€” with built-in interactive visualizations powered by MCP Apps.

Search thousands of public datasets, profile their structure, generate charts, and plot geographic data on maps β€” all from your AI assistant.

Tests Python 3.10+ License: MIT


What Can You Do With This?

🏠 Explore the Housing Market

Profile public housing datasets to understand unit sizes, locations, and availability:
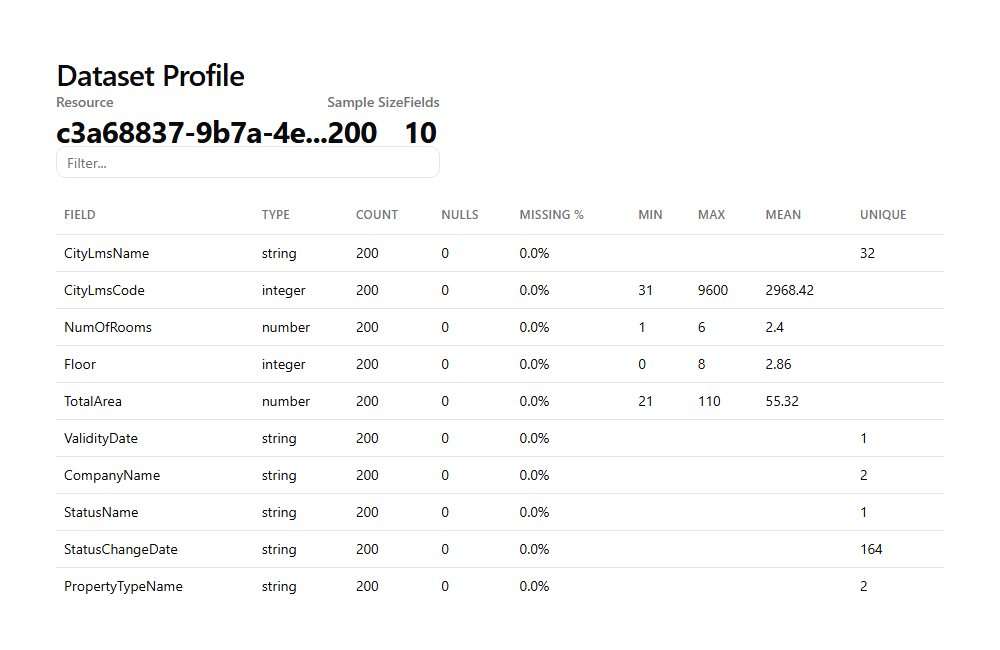
Dataset Profile β€” Public Housing

See which cities have the most demand in government housing lotteries:
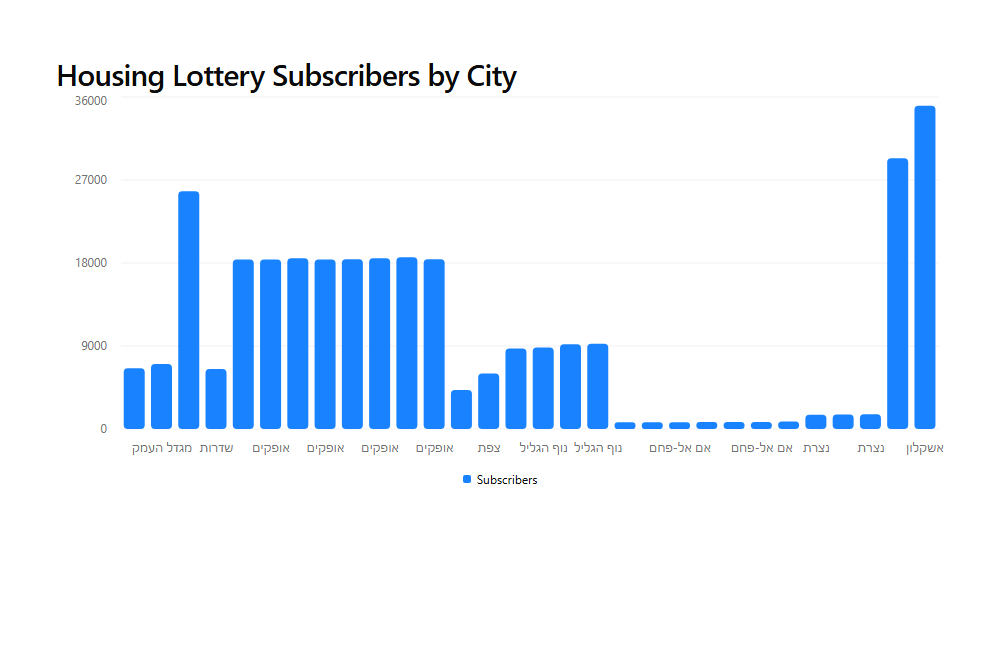
Housing Lottery Subscribers by City

Understand the distribution of apartment sizes across the country:
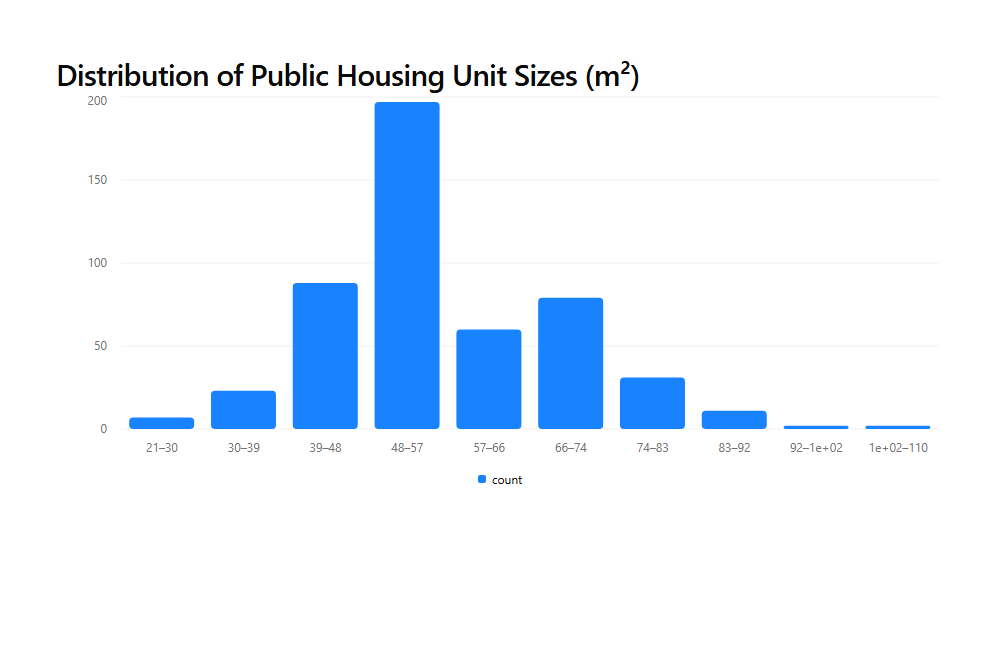
Distribution of Public Housing Unit Sizes

Track housing unit availability over time:
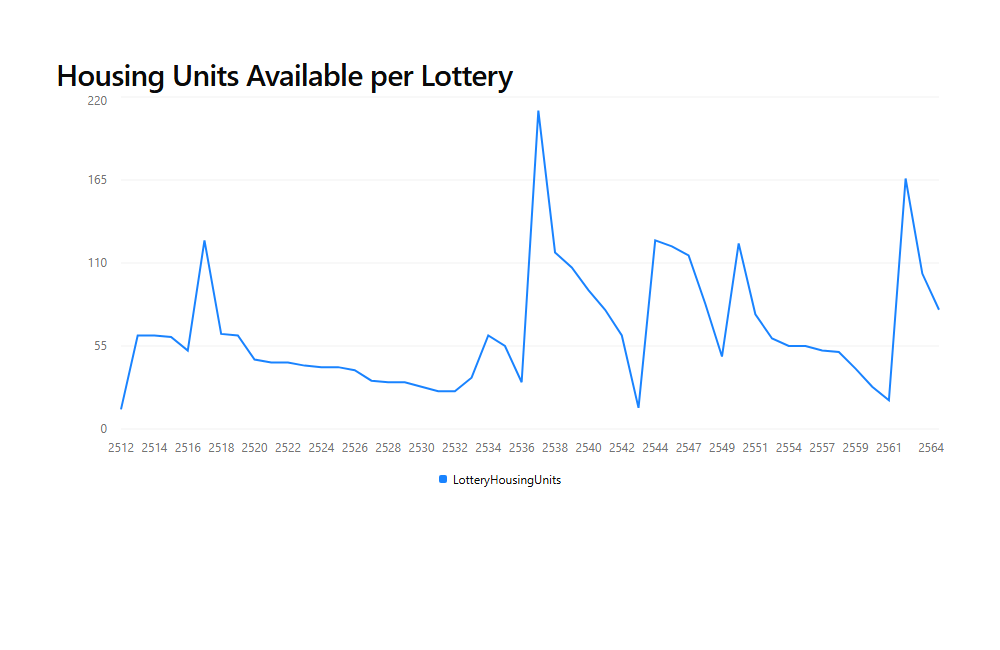
Housing Units Available per Lottery

πŸ—ΊοΈ Map Public Infrastructure

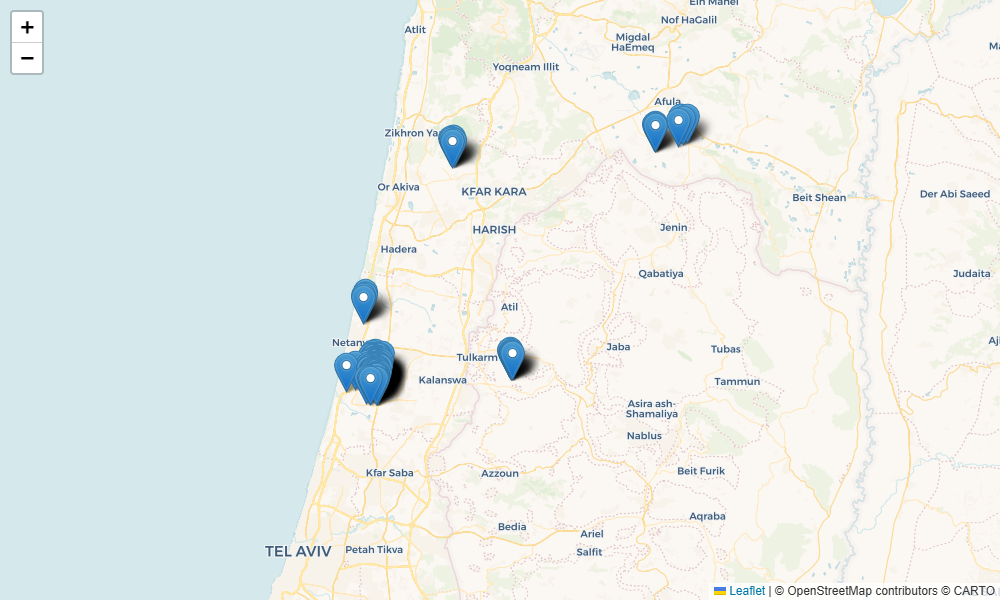
Visualize education institutions across Israel:
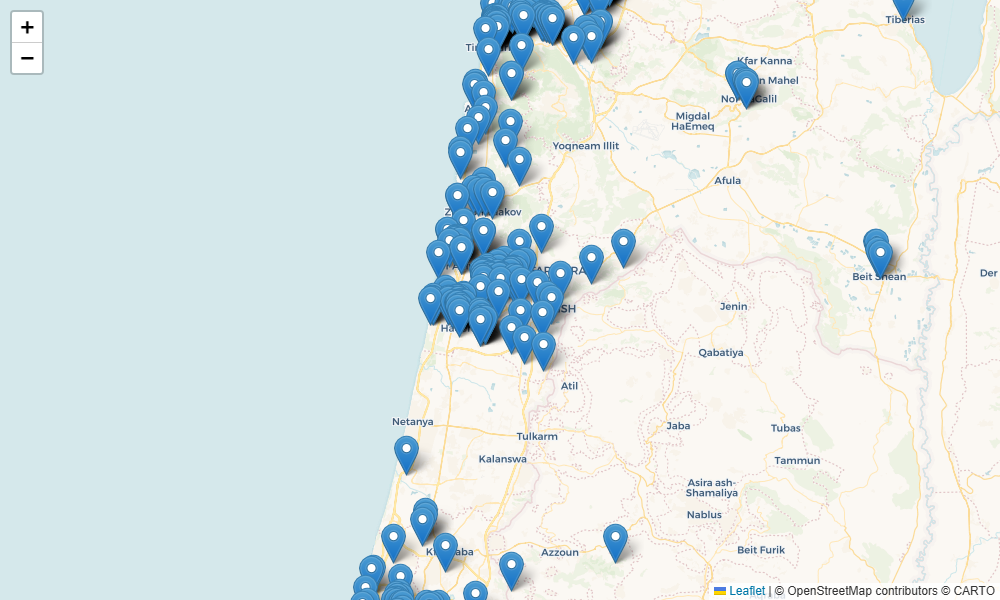
Education Institutions Map

Plot public transport stations:

Public Transport Stations


Quick Start

Installation

git clone https://github.com/aviveldan/datagov-mcp.git
cd datagov-mcp

# Create virtual environment and install (requires uv)
uv venv
source .venv/bin/activate  # On Windows: .venv\Scripts\activate
uv pip install -e ".[dev]"

Using with Claude Desktop

fastmcp install claude-desktop server.py

Restart Claude Desktop β€” you'll see the DataGovIL tools available immediately.

Try It with the MCP Inspector

fastmcp dev inspector server.py

This opens a web UI where you can browse tools, test them interactively, and preview MCP App visualizations in the Apps tab.

Using with fastmcp dev apps

Preview the interactive visualization apps locally:

fastmcp dev apps server.py

Example: Finding Real Estate Opportunities

Here's a real workflow for someone exploring the Israeli housing market:

You: "Search for discounted housing lottery datasets"

β†’ package_search(q="Χ“Χ™Χ¨Χ” Χ‘Χ”Χ Χ—Χ”")
  Found: "Χ Χͺונים ΧͺΧ§Χ•Χ€Χͺיים - ΧͺΧ›Χ Χ™Χͺ Χ“Χ™Χ¨Χ” Χ‘Χ”Χ Χ—Χ”" (Discounted Housing Program)
  Resource ID: 7c8255d0-49ef-49db-8904-4cf917586031

You: "Profile this dataset so I can understand what fields are available"

β†’ dataset_profile(resource_id="7c8255d0-49ef-49db-8904-4cf917586031")
  Shows: LamasName (city), Subscribers, Winners, PriceForMeter,
         LotteryHousingUnits, ProjectName, Neighborhood...

You: "Show me which cities have the most subscribers competing for units"

β†’ chart_generator(
    resource_id="7c8255d0-49ef-49db-8904-4cf917586031",
    chart_type="bar",
    x_field="LamasName",
    y_field="Subscribers",
    title="Housing Lottery Subscribers by City"
  )
  β†’ Interactive bar chart rendered in MCP Apps UI

You: "Now show the public housing units β€” map them and show me sizes"

β†’ dataset_profile(resource_id="c3a68837-9b7a-4ee7-bd92-130678dc8ae3")
  Shows: CityLmsName, NumOfRooms (avg 2.4), Floor, TotalArea (21-110 mΒ²)...

β†’ chart_generator(
    resource_id="c3a68837-9b7a-4ee7-bd92-130678dc8ae3",
    chart_type="histogram",
    x_field="TotalArea",
    title="Distribution of Housing Unit Sizes (mΒ²)"
  )
  β†’ Most units are 48-57 mΒ², with a long tail up to 110 mΒ²

Insight: Cities like Ashkelon and Sderot show 25,000-35,000 subscribers per lottery β€” that's intense competition. Smaller cities in the periphery (Umm al-Fahm, Nazareth) have far fewer. If you're flexible on location, your odds improve dramatically.


Available Tools

Core Data Tools

Tool Description
status_show Get CKAN version and site info
license_list List available dataset licenses
package_list Get all dataset IDs
package_search Search datasets with filters and sorting
package_show Get detailed metadata for a specific dataset
organization_list List all organizations
organization_show Get details of a specific organization
resource_search Search for resources within datasets
datastore_search Query data within a specific resource
fetch_data Convenience tool β€” find dataset by name and fetch its data

Visualization Tools (MCP Apps) πŸ“Š

These tools render interactive UI directly in MCP-compatible clients.

dataset_profile

Profile a dataset to understand its structure and quality.

  • Fields detected: integer, number, string, coordinate
  • Statistics: min, max, mean, null count, unique values
  • Output: Interactive DataTable with search/filter
dataset_profile(resource_id="c3a68837-9b7a-4ee7-bd92-130678dc8ae3", sample_size=200)
chart_generator

Generate interactive charts from any dataset.

Chart Type Use Case
histogram Distribution of numeric values (e.g., apartment sizes)
bar Compare categories (e.g., subscribers per city)
line Trends over time (e.g., housing units per lottery)
scatter Correlations between two numeric fields
chart_generator(
  resource_id="7c8255d0-49ef-49db-8904-4cf917586031",
  chart_type="bar",
  x_field="LamasName",
  y_field="Subscribers",
  title="Housing Lottery Subscribers by City",
  limit=50
)
map_generator

Plot geographic data on interactive Leaflet maps.

map_generator(
  resource_id="e873e6a2-66c1-494f-a677-f5e77348edb0",
  lat_field="Lat",
  lon_field="Long",
  limit=500
)

Useful Resource IDs

Here are some interesting datasets to get started with:

Dataset Resource ID Good For
✈️ Flights (Χ˜Χ™Χ‘Χ•Χͺ) e83f763b-b7d7-479e-b172-ae981ddc6de5 Bar charts by airline
🏠 Public Housing (Χ“Χ™Χ•Χ¨ Χ¦Χ™Χ‘Χ•Χ¨Χ™) c3a68837-9b7a-4ee7-bd92-130678dc8ae3 Histograms, profiling
🎰 Housing Lotteries (Χ“Χ™Χ¨Χ” Χ‘Χ”Χ Χ—Χ”) 7c8255d0-49ef-49db-8904-4cf917586031 Bar/line charts
🚌 Transport Stations (ΧͺΧ—Χ Χ•Χͺ) e873e6a2-66c1-494f-a677-f5e77348edb0 Maps (has Lat/Long)
🏫 Schools (ΧžΧ•Χ‘Χ“Χ•Χͺ Χ—Χ™Χ Χ•Χš) 5c5d6bb0-755d-470d-84b6-d7dd3135ba9c Maps (UTM_X/UTM_Y)

Architecture

MCP Apps

Visualization tools use FastMCPApp providers with prefab-ui components:

  • DataProfile app β†’ DataTable, Metric components
  • Charts app β†’ BarChart, LineChart, ScatterChart, Histogram
  • Maps app β†’ Embed with Leaflet HTML

Tools registered via @app.ui() automatically get proper MCP Apps metadata and render in compatible clients.

Async HTTP Layer

All API calls use httpx.AsyncClient with:

  • 30-second timeout
  • Automatic retries for 5xx errors
  • Connection pooling

Data Safety

  • Numeric values from CKAN are coerced (handles "25" β†’ 25.0)
  • Map popup content is HTML-escaped to prevent XSS
  • Line charts are sorted by x-axis for correct rendering

Development

Running Tests

pytest tests/ -v          # 39 tests
pytest tests/ --cov=datagov_mcp  # With coverage

Code Style

ruff check .   # Lint
ruff format .  # Format

Project Structure

datagov-mcp/
β”œβ”€β”€ datagov_mcp/
β”‚   β”œβ”€β”€ server.py          # Core CKAN tools + provider registration
β”‚   β”œβ”€β”€ apps.py            # FastMCPApp definitions (DataProfile, Charts, Maps)
β”‚   β”œβ”€β”€ visualization.py   # Visualization tools (@app.ui entry points)
β”‚   β”œβ”€β”€ api.py             # CKAN API helper
β”‚   └── client.py          # HTTP client
β”œβ”€β”€ tests/                 # 39 tests with HTTP mocking
β”‚   β”œβ”€β”€ test_api.py
β”‚   β”œβ”€β”€ test_contracts.py
β”‚   β”œβ”€β”€ test_tools.py
β”‚   └── test_visualization.py
β”œβ”€β”€ screenshots/           # Auto-generated demo screenshots
β”œβ”€β”€ server.py              # Entrypoint
└── pyproject.toml

Contributing

We welcome contributions! See CONTRIBUTING.md for guidelines.

  1. Fork the repository
  2. Create a feature branch
  3. Make changes with tests
  4. Submit a pull request

Troubleshooting

Port Conflicts with MCP Inspector

pip install nano-dev-utils
python -c "from nano_dev_utils import release_ports; release_ports.PortsRelease().release_all()"

Windows + OneDrive

Avoid running installation in OneDrive-synced folders. See uv#7906.

Import Errors

uv pip install -e ".[dev]"

License

MIT β€” see LICENSE.

Acknowledgments

datagov-mcp FAQ

Do I need a key or an account?
No. The Israeli open data portal is free and public, so there is nothing to sign up for and nothing to pay.
Are the charts drawn from all the data?
No, and this matters. A chart uses the first hundred rows and a map the first five hundred, with no totalling up beforehand, so a picture of a large dataset shows a slice rather than the whole thing.
Which apps does it work in?
It installs into Claude Desktop with one command. The charts, tables and maps only appear in apps that support interactive panels; elsewhere you still get the underlying numbers.
Can I use this to explore the housing market?
Yes. Search for the housing lottery or public housing datasets, ask what fields they contain, then ask for a chart of entrants by city or a spread of apartment sizes.
Is the data in English?
Mostly not. Dataset titles and column names are largely Hebrew, so you will often be reading Hebrew field names even when the conversation is in English.
Do the map examples in the readme all work?
Not all. The schools dataset it suggests stores its coordinates in a different system and nothing converts them, so those points land in the wrong place. The transport stations dataset has plain latitude and longitude and maps correctly.
How hard is the setup?
Technical. You copy the code down, create a Python environment, install it and then run one command to register it with Claude Desktop.
Does anything leave my computer?
Yes. Every request goes to the government portal, and maps additionally load their mapping software and map tiles from public third-party sites.