Fire in da houseTop Tip:Paying $100+ per month for Perplexity, MidJourney, Runway, ChatGPT and other tools is crazy - get all your AI tools in one site starting at $15 per month with Galaxy AI Fire in da houseCheck it out free

mcp-server-prometheus

MCP.Pizza Chef: loglmhq

mcp-server-prometheus is a TypeScript-based MCP server that enables seamless interaction between large language models like Claude and Prometheus monitoring systems. It implements the Prometheus API interface, allowing models to query and retrieve detailed metric schemas, metadata, and statistical data such as count, min, and max values. This server supports secure access via basic authentication and provides structured JSON data for efficient processing. It is ideal for integrating real-time Prometheus metrics into AI workflows, enabling advanced monitoring, alerting, and data analysis through natural language interfaces.

Use This MCP server To

Query Prometheus metrics via natural language Retrieve detailed metric metadata and statistics Integrate Prometheus data into AI monitoring tools Enable secure access to Prometheus metrics Provide structured JSON data for metric analysis

README

mcp-server-prometheus

MCP server for interacting with Prometheus metrics and data.

This is a TypeScript-based MCP server that implements a Prometheus API interface. It provides a bridge between Claude and your Prometheus server through the Model Context Protocol (MCP).

mcp-server-prometheus MCP server

Demo

demo

Features

Resources

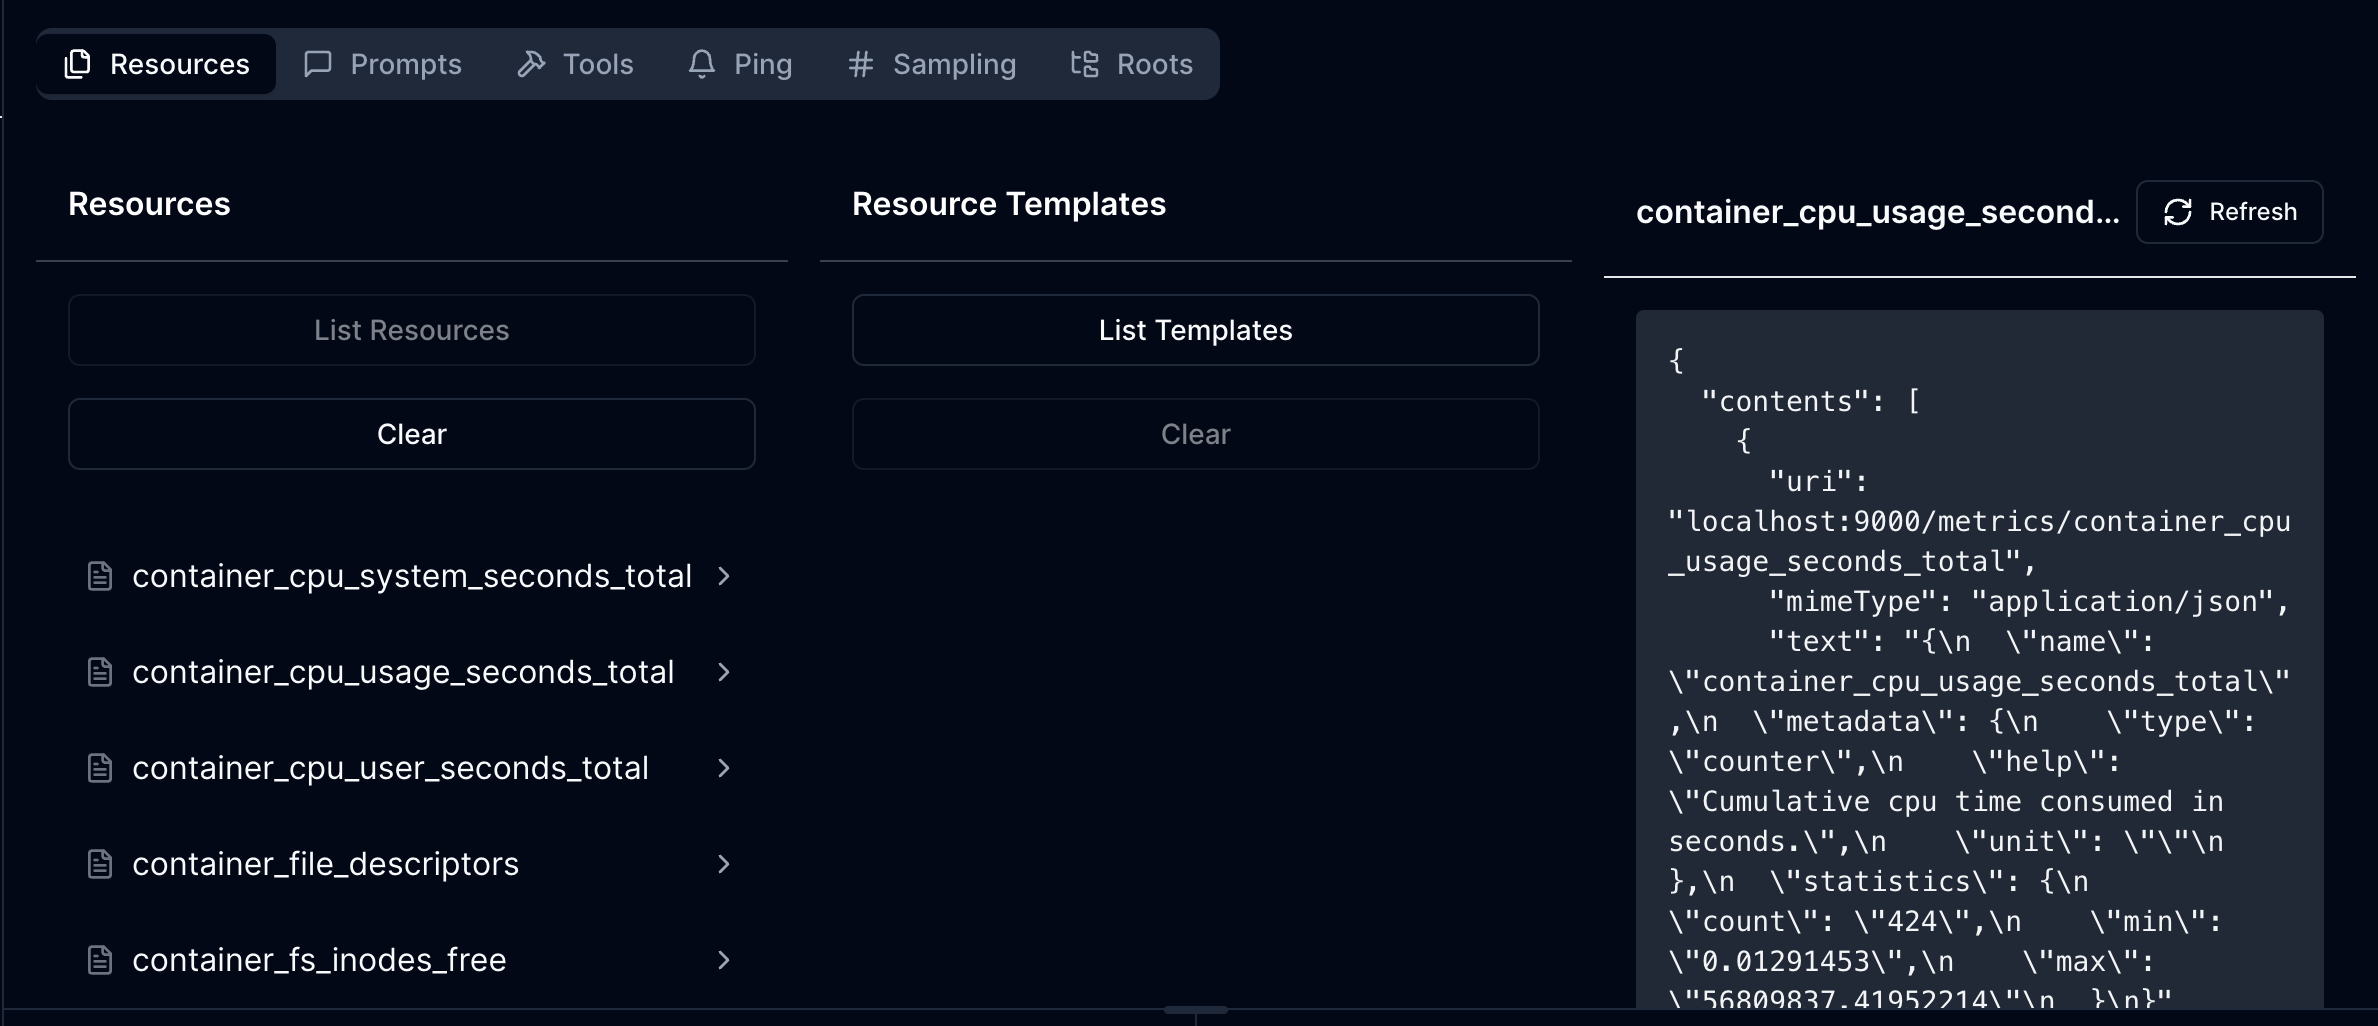
  • List and access Prometheus metric schema
  • Each metric resource provides:
    • Metric name and description
    • Detailed metadata from Prometheus
    • Statistical information (count, min, max)
  • JSON mime type for structured data access

Current Capabilities

  • List all available Prometheus metrics with descriptions
  • Read detailed metric information including:
    • Metadata and help text
    • Current statistical data (count, min, max values)
  • Basic authentication support for secured Prometheus instances

Configuration

The server requires the following environment variable:

  • PROMETHEUS_URL: The base URL of your Prometheus instance

Optional authentication configuration:

  • PROMETHEUS_USERNAME: Username for basic auth (if required)
  • PROMETHEUS_PASSWORD: Password for basic auth (if required)

Development

Install dependencies:

npm install

Build the server:

npm run build

For development with auto-rebuild:

npm run watch

Installation

To use with Claude Desktop, add the server config:

On MacOS: ~/Library/Application Support/Claude/claude_desktop_config.json On Windows: %APPDATA%/Claude/claude_desktop_config.json

{
  "mcpServers": {
    "mcp-server-prometheus": {
      "command": "/path/to/mcp-server-prometheus/build/index.js",
      "env": {
        "PROMETHEUS_URL": "http://your-prometheus-instance:9090"
      }
    }
  }
}

Debugging

Since MCP servers communicate over stdio, debugging can be challenging. We recommend using the MCP Inspector:

npm run inspector

The Inspector will provide a URL to access debugging tools in your browser.

API Structure

The server exposes Prometheus metrics through the following URI structure:

  • Base URI: http://your-prometheus-instance:9090
  • Metric URIs: http://your-prometheus-instance:9090/metrics/{metric_name}

Each metric resource returns JSON data containing:

  • Metric name
  • Metadata (help text, type)
  • Current statistics (count, min, max)

mcp-server-prometheus FAQ

How does mcp-server-prometheus authenticate requests?
It supports basic authentication to securely connect to your Prometheus server, ensuring authorized access to metrics.
What kind of Prometheus data can I access with this MCP server?
You can list all available metrics, view detailed metadata, descriptions, and statistical information like count, min, and max values.
Is mcp-server-prometheus compatible with multiple LLM providers?
Yes, it works with models such as Claude, OpenAI's GPT, and Gemini through the Model Context Protocol.
How is metric data formatted when retrieved?
Metric data is provided in JSON mime type, allowing structured and easy-to-parse access for downstream applications.
Can I use mcp-server-prometheus to monitor real-time Prometheus metrics?
Yes, it enables real-time querying and retrieval of Prometheus metrics for up-to-date monitoring and analysis.
What programming language is mcp-server-prometheus built with?
It is implemented in TypeScript, ensuring strong typing and modern development practices.
Does mcp-server-prometheus support custom Prometheus queries?
Currently, it focuses on listing and reading metric schemas and statistics, with basic API interface support.
How do I integrate mcp-server-prometheus with my existing MCP client?
Simply configure your MCP client to connect to this server endpoint, enabling seamless Prometheus data access within your AI workflows.