
English · 简体中文
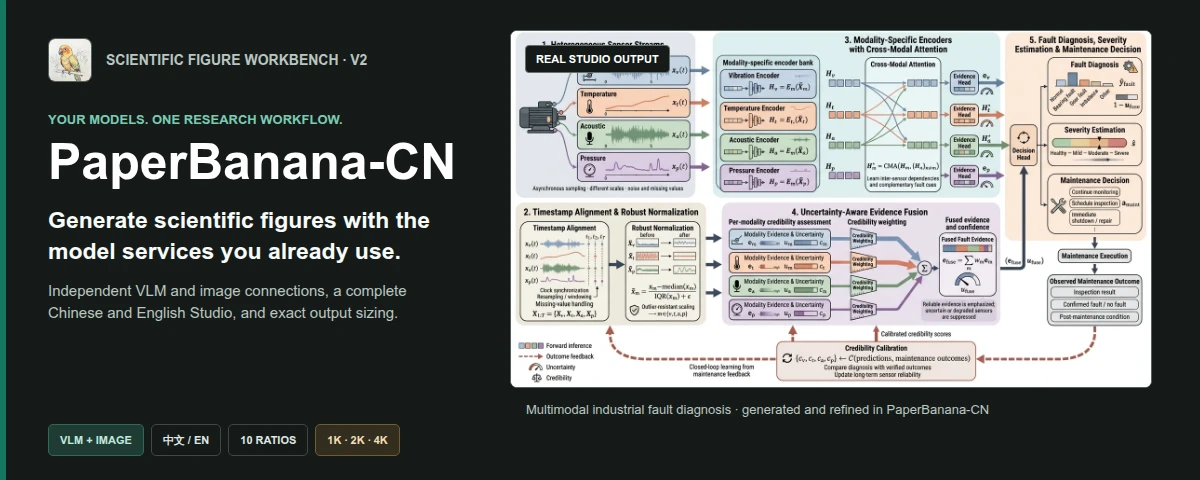
PaperBanana-CN generates methodology diagrams from research descriptions and statistical plots from CSV or JSON data. It uses the PaperBanana scientific workflow and adds separate VLM and image-service connections, a Chinese Studio interface, and explicit aspect-ratio and resolution controls.




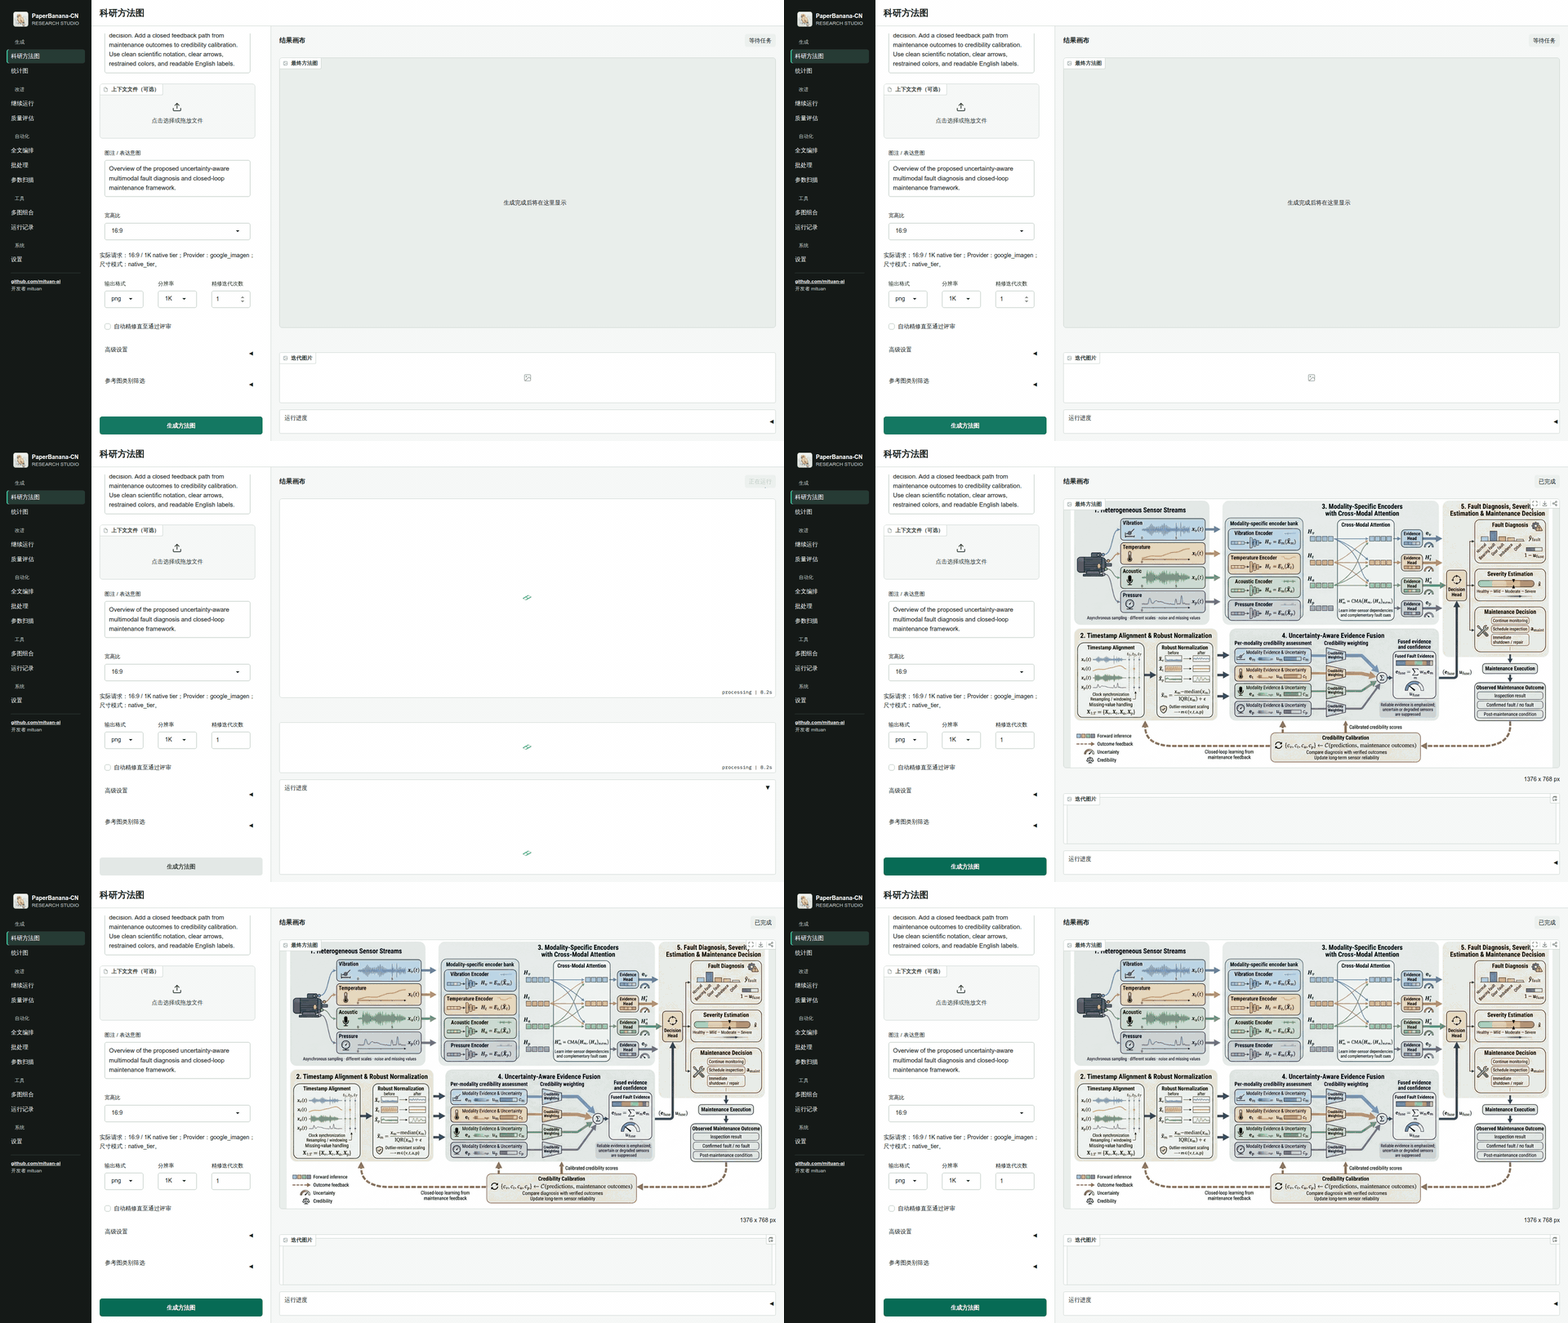
The recording follows a methodology-diagram run from submitted inputs to the completed result.
You need Python 3.10-3.12, uv, and a desktop browser.
| Task | Required model connections |
|---|---|
| Methodology diagram | VLM and image generation |
| Statistical plot | VLM only |
| Multi-panel composition and run browsing | None |
Each connection specifies its own protocol, Base URL, API key, model name, and timeout. The VLM and image roles may use the same service or two different services.